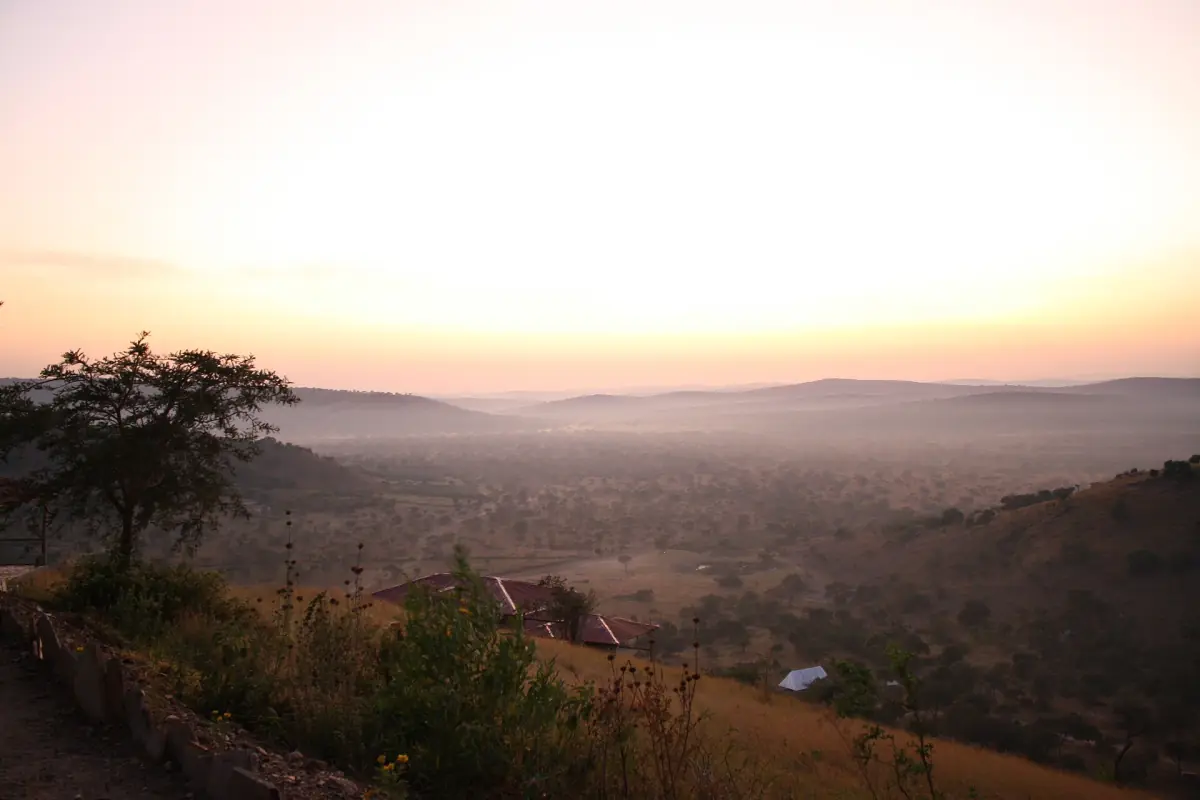
Mbarara weather and Lake Mburo at a glance
Lake Mburo lies in south-western Uganda at 1,220 to 1,828 metres above sea level. The table below uses Mbarara, the nearest large town, as a regional reference, not a station at the lake. Conditions at the lake can differ a little. The figures are long-term monthly averages for 1961 to 1990, not a forecast for your travel dates.
The year has two rainy seasons and two drier phases. Days stay warm all year, with average highs of 26 to 27 °C, and nights are cool, with lows near 13 to 14 °C. Rain shapes the trip more than temperature does. If you already know when you will go, read the Lake Mburo safari page for how to plan the days.
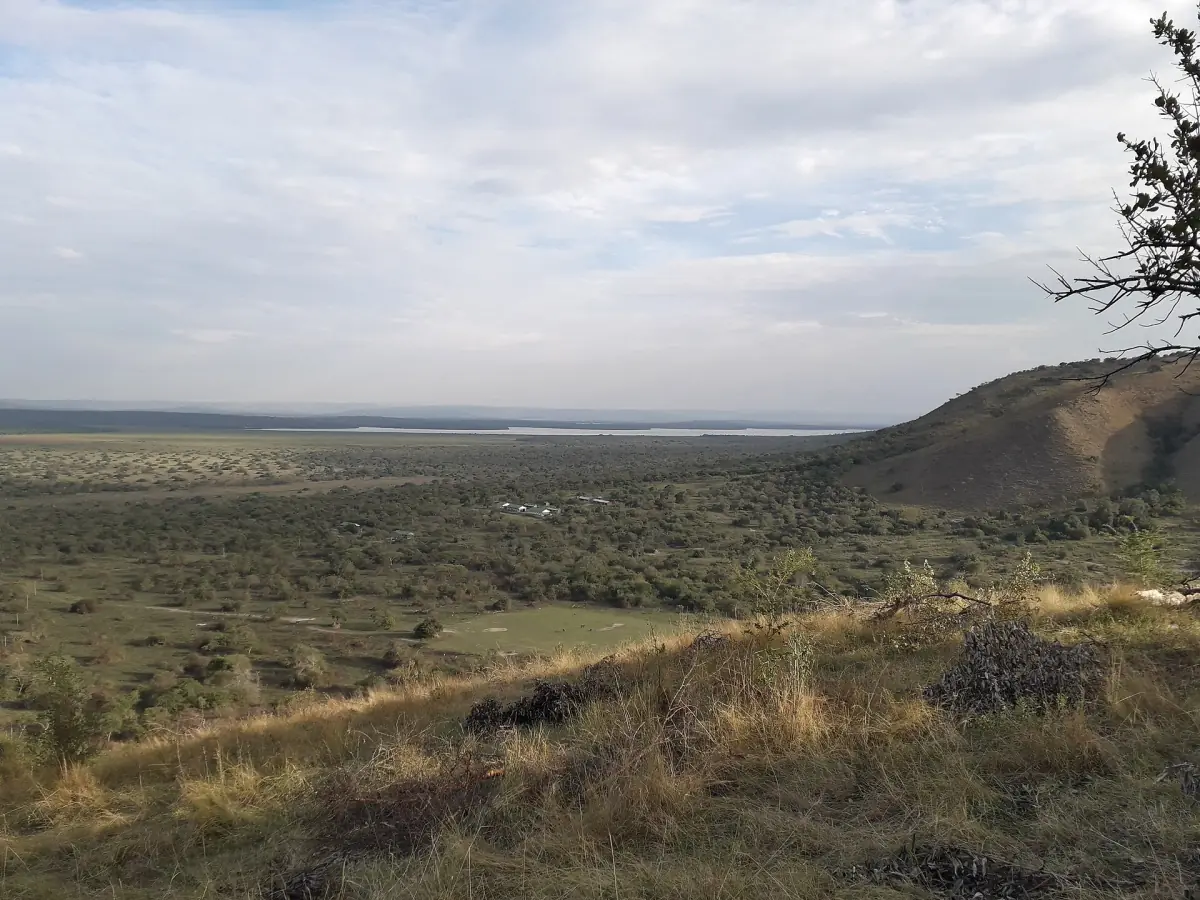
Mbarara weather by month
Average daily high and low, and average monthly rainfall.
| Month | High °C | Low °C | Rain mm |
|---|---|---|---|
| January | 26.9 | 13.5 | 53.3 |
| February | 27.3 | 13.9 | 56.1 |
| March | 27.1 | 14.3 | 96.6 |
| April | 26.3 | 14.3 | 119.5 |
| May | 26.3 | 13.9 | 67.8 |
| June | 26.7 | 13.5 | 23.0 |
| July | 27.0 | 13.4 | 24.1 |
| August | 27.0 | 14.1 | 68.8 |
| September | 26.9 | 14.0 | 108.0 |
| October | 26.1 | 14.4 | 127.5 |
| November | 25.8 | 14.3 | 131.4 |
| December | 26.1 | 13.6 | 76.3 |
November is the wettest month in the table at 131.4 mm, followed by October and April. June and July are the driest, with 23.0 and 24.1 mm.
Our pick: a trip to plan around the weather
Game drives in two parks, with Lake Mburo on days three and four and a guide throughout.
Hand-picked tours, booked through GetYourGuide. Prices are indicative starting prices in US dollars (as of October 2026). Tap a tour for live availability and the current price in your currency.
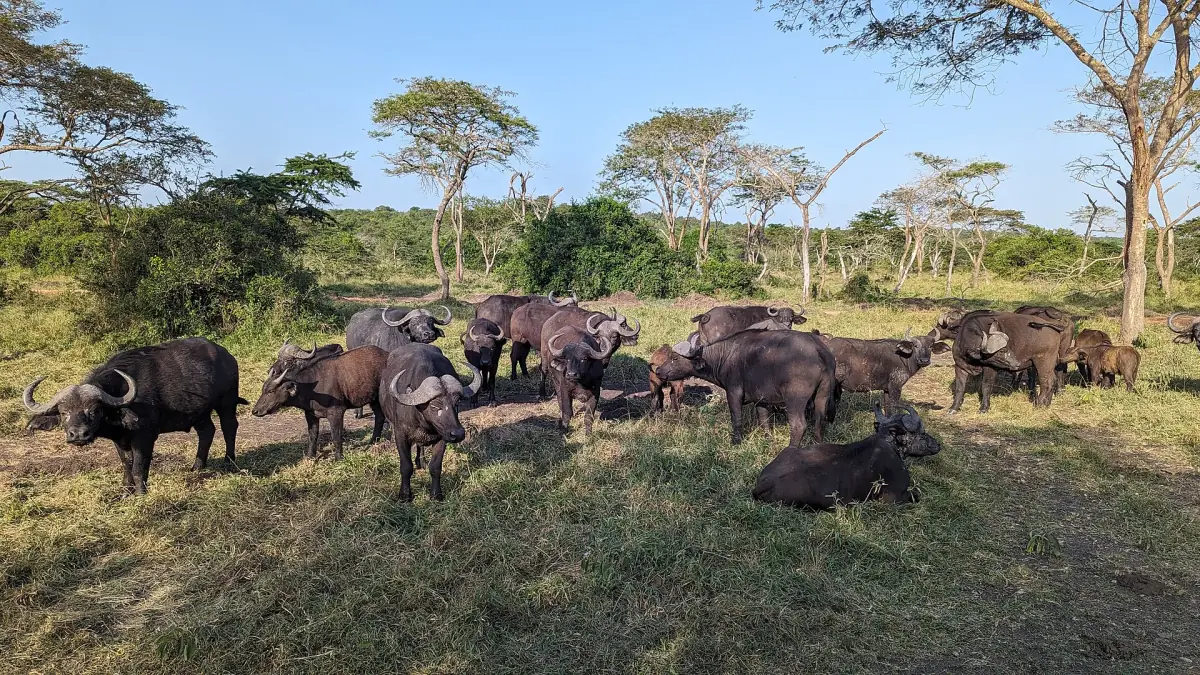
Lake Mburo tours in every season
Game drives, boat cruises and trips from Kampala, with live prices and availability for your dates.
The best time to visit Lake Mburo
Drier months suit game drives, but the park can be visited all year.
June to August
This is the first drier phase and the one with the lowest rain figures. June and July are the driest months. August is not fully dry, with 68.8 mm on average.
December to February
The second drier phase. Rain is lower than in the wet months, with 53.3 to 76.3 mm per month.
March to May
The first rainy season. April is the wettest of the three months with 119.5 mm. Expect showers.
September to November
The second rainy season. October and November both exceed 125 mm. Pack rain gear and allow time for slower driving.
A drier month is a general guide, not a promise of dry days or of animals gathered in one place. Wildlife is spread through the park in every season. For planning, a dry spell of a few days matters more than the month.
What to pack and how to plan
Weather tips for Lake Mburo.
Layers
Days are warm and nights are cool, so pack a light layer for the early morning and the evening on the lake.
Rain gear
Even in the drier months, a shower can come. A light rain jacket is a sensible item in any month.
Roads and tracks
Ask your guide or the park office about track conditions after heavy rain. Allow extra time on the road from Kampala, which takes about 3½ hours without stops. Read the getting there page for the route.
Fees
See the park fees page for entry and activity rates.
After Lake Mburo, many travellers go on to the gorillas in Bwindi, which has its own seasons. See the Bwindi best time to visit page.
More about Lake Mburo
Pages that go with the season.
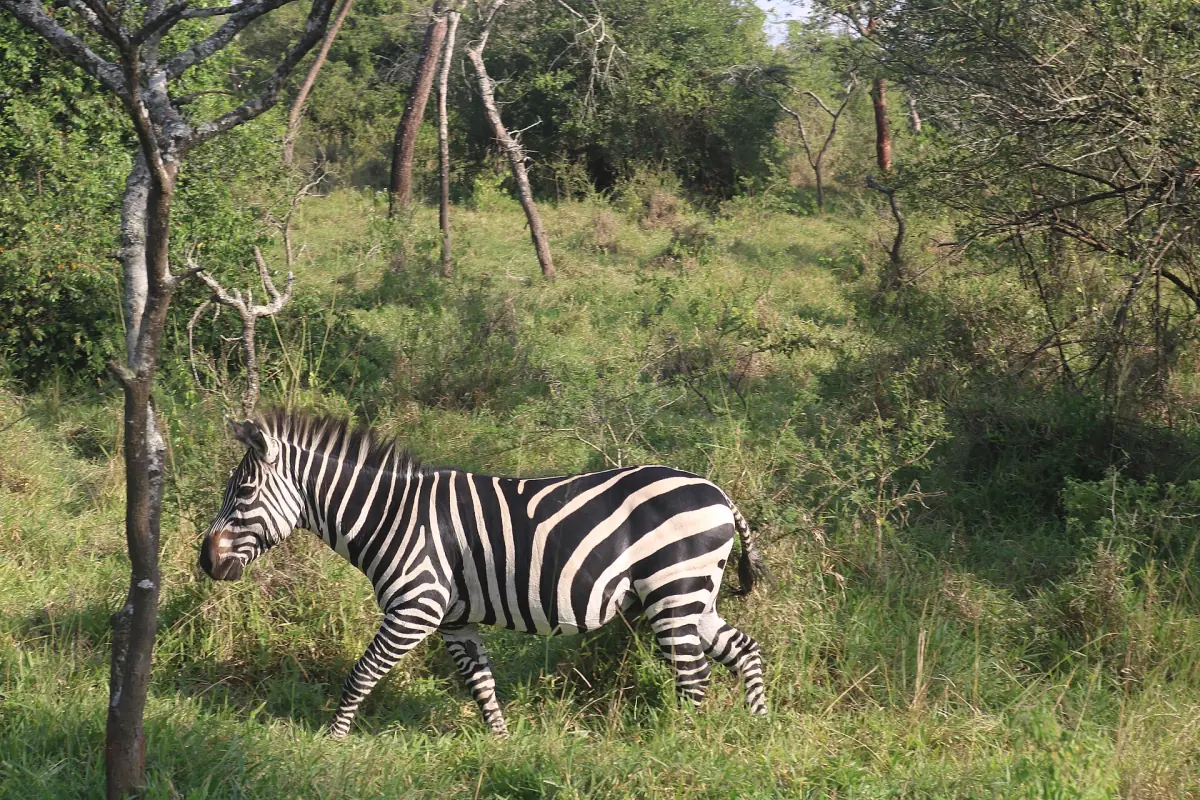
Lake Mburo weather: frequently asked questions
When is the best time to visit Lake Mburo?
The drier phases, June to August and December to February, suit game viewing. The park can be visited all year, and no month guarantees dry days.
When are the rainy seasons?
March to May and September to November. In the Mbarara figures, April, October and November are the wettest months.
How warm does it get?
Average daily highs in Mbarara are 25.8 to 27.3 °C all year. Average lows are 13.4 to 14.4 °C.
Why do you use Mbarara weather?
Mbarara is the nearest large town and a regional reference. Conditions at the lake can differ a little, and the figures are averages, not a forecast.
Is the table a forecast?
No. The figures are long-term averages for 1961 to 1990. Check a current forecast before you travel.